
The COVID-19 crisis underscores the pivotal role American employers play in the lives of their employees. Now more than ever, organizations seek to maximize their return on investment in their people’s health and wellness. Benefits leaders must understand plan performance, identify opportunities, and implement changes to improve both health and cost outcomes.
Good benefits decisions require a deep understanding of data. “What’s driving my spend?” or “where can I improve utilization?” are simple questions, but finding crisp answers—and measuring the impact of changes—often requires looking at data in a variety of ways.
Today, Collective Health launched the first phase of our new claims analytics tools, designed to empower teams to craft, evaluate, and iterate on their benefits strategy.
What’s New:
With this product release, clients and consultant partners gain access to our first phase of claims insights:
- Service category visualizations, year-over-year comparisons, and deep dives help spot opportunities for change and allow further exploration.
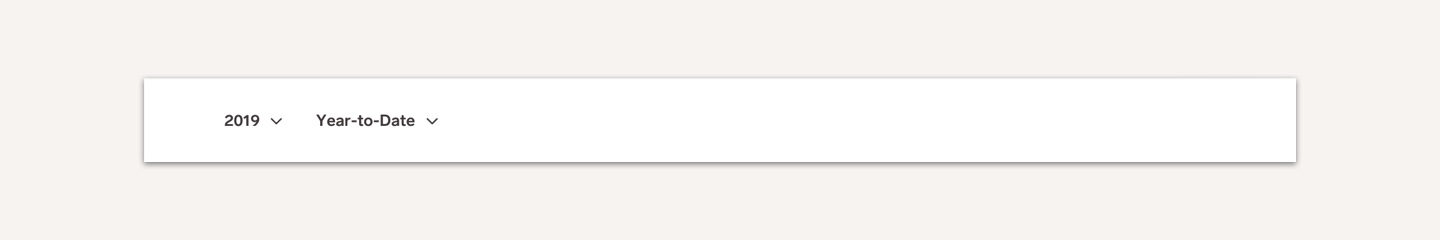
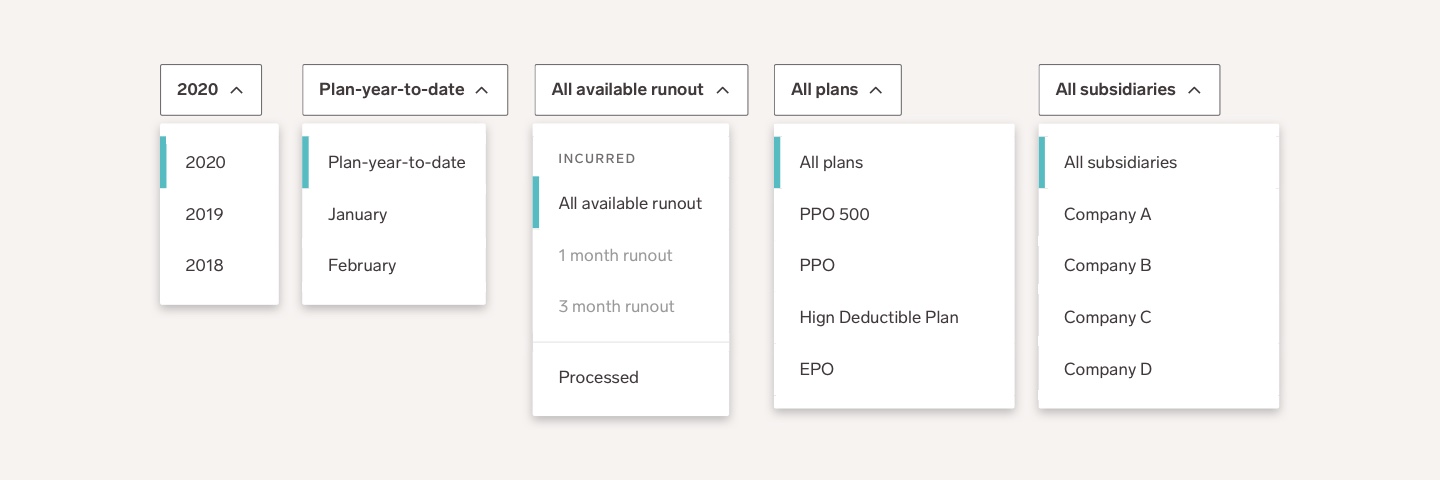
- Enhanced claims data filters make it possible to view spend for various plans, populations, and incurred vs. processed date ranges.
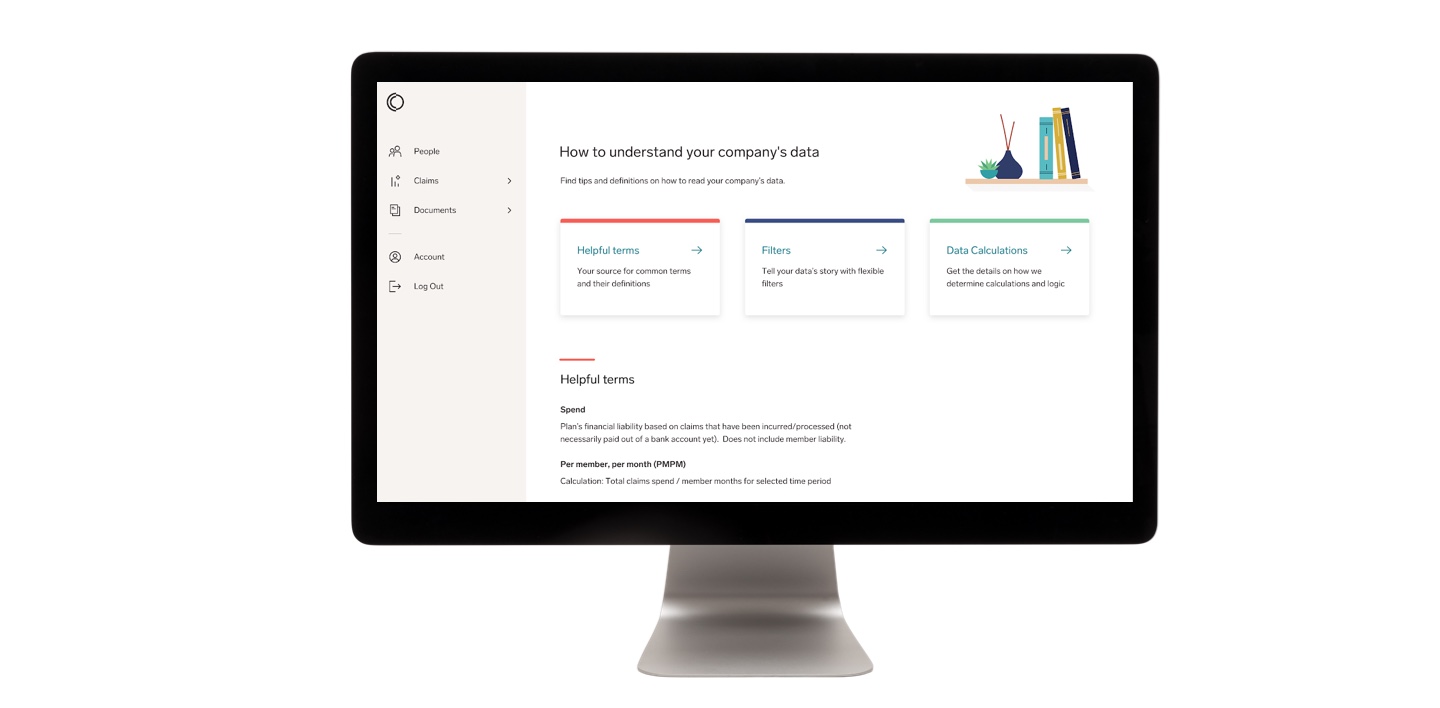
- Understanding Your Data guide with explanations of key terms, filter logic, and calculations, gives context to support data interpretation.
Our 50+ enterprise clients gain access to this functionality immediately.
Identify trends and opportunities through deep dives and visualizations
Our claims insights are built to support action: helping benefits teams understand what drives spend, identifying opportunities for improvement, and gathering data to support changes. Today, we’ve expanded the Claims section of the employer suite, equipping teams with visualizations to easily spot trends and quickly drill-down to details.
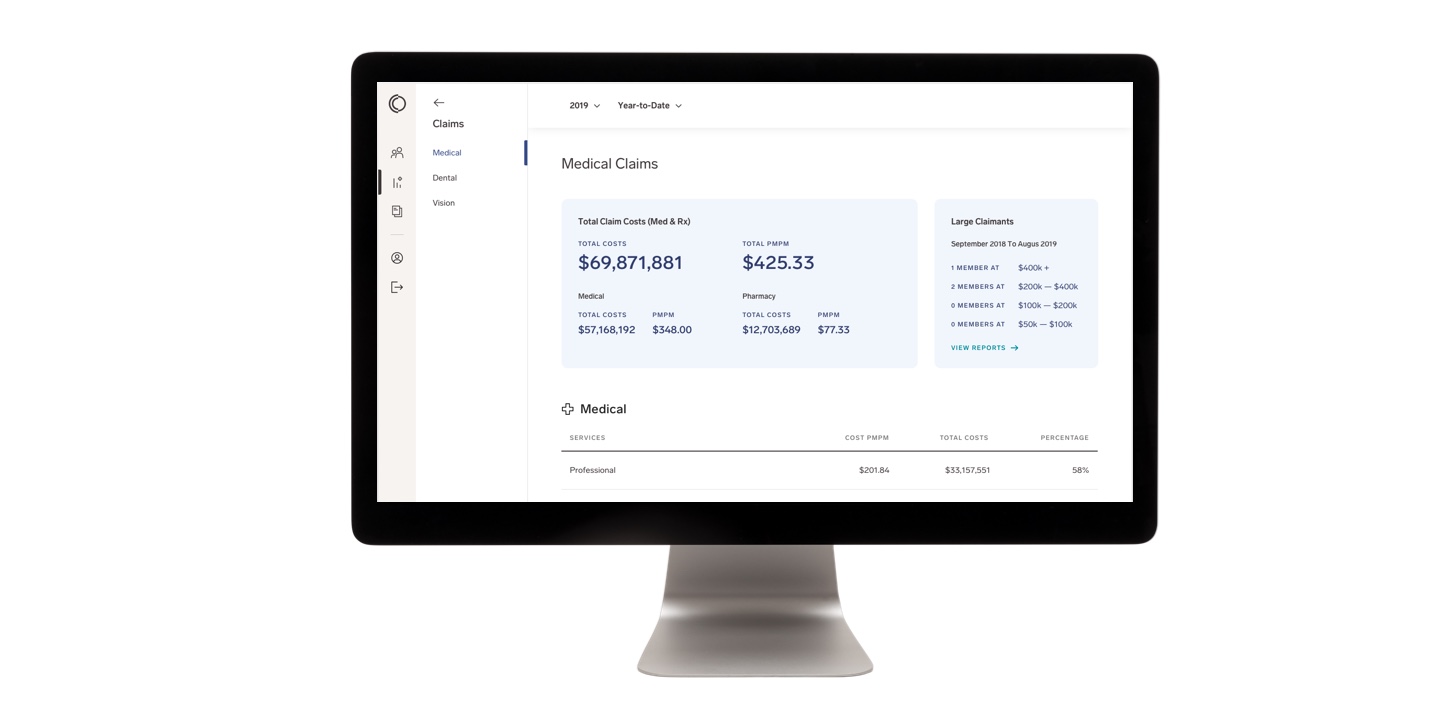
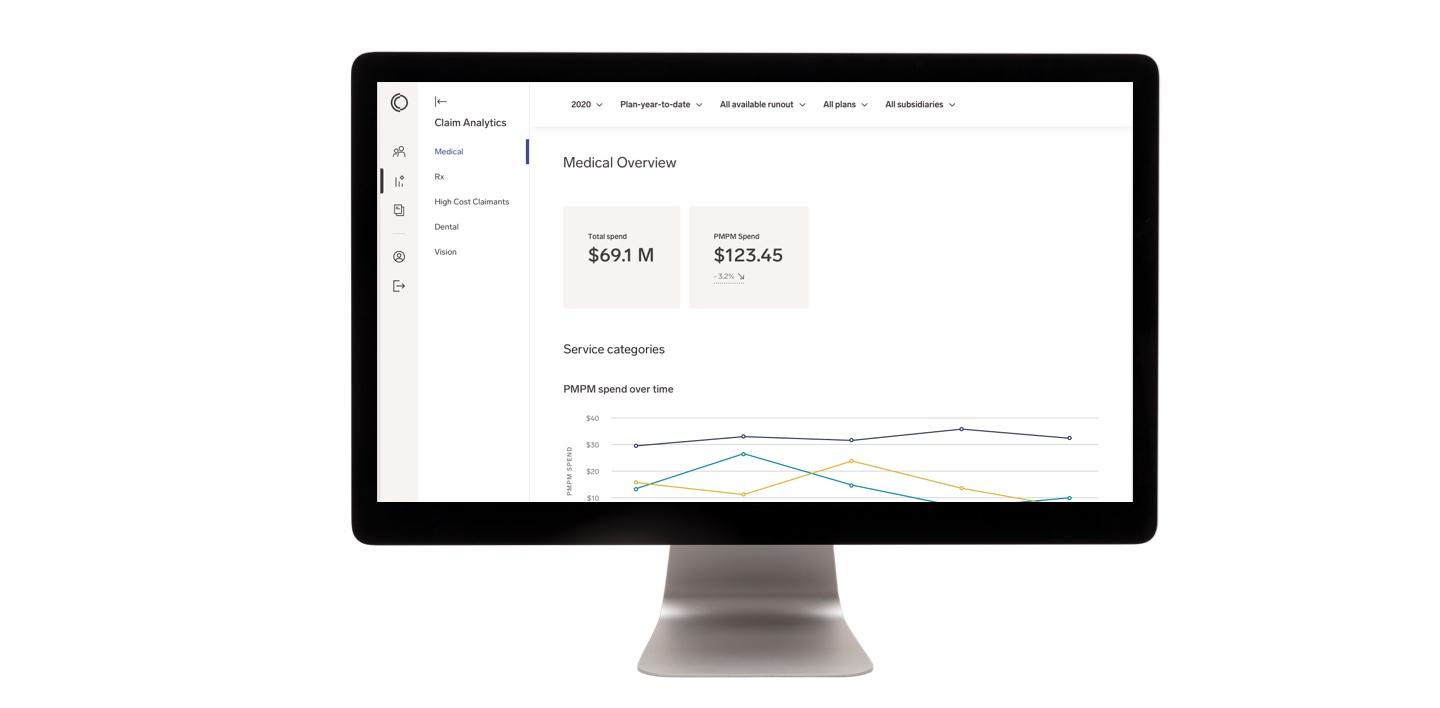
For instance, on the Medical Overview page, new data visualizations and comparisons—updated daily—serve to identify patterns, anomalies, and opportunities for improvement. Putting plan performance in context is especially critical: year-over-year comparisons of per member per month (PMPM) costs allow employers to measure spend against their own baseline. Graphs of PMPM spend over time help benefits leaders know what to analyze and give teams an easy visual aid to understand how employees use their health and wellness services and offerings.
We’ve also updated our layout to shift pharmacy data onto its own page, paving the way for enhanced analytics on employee utilization of pharmacy benefits and key drivers of pharmacy costs.
Previous Design
New Design
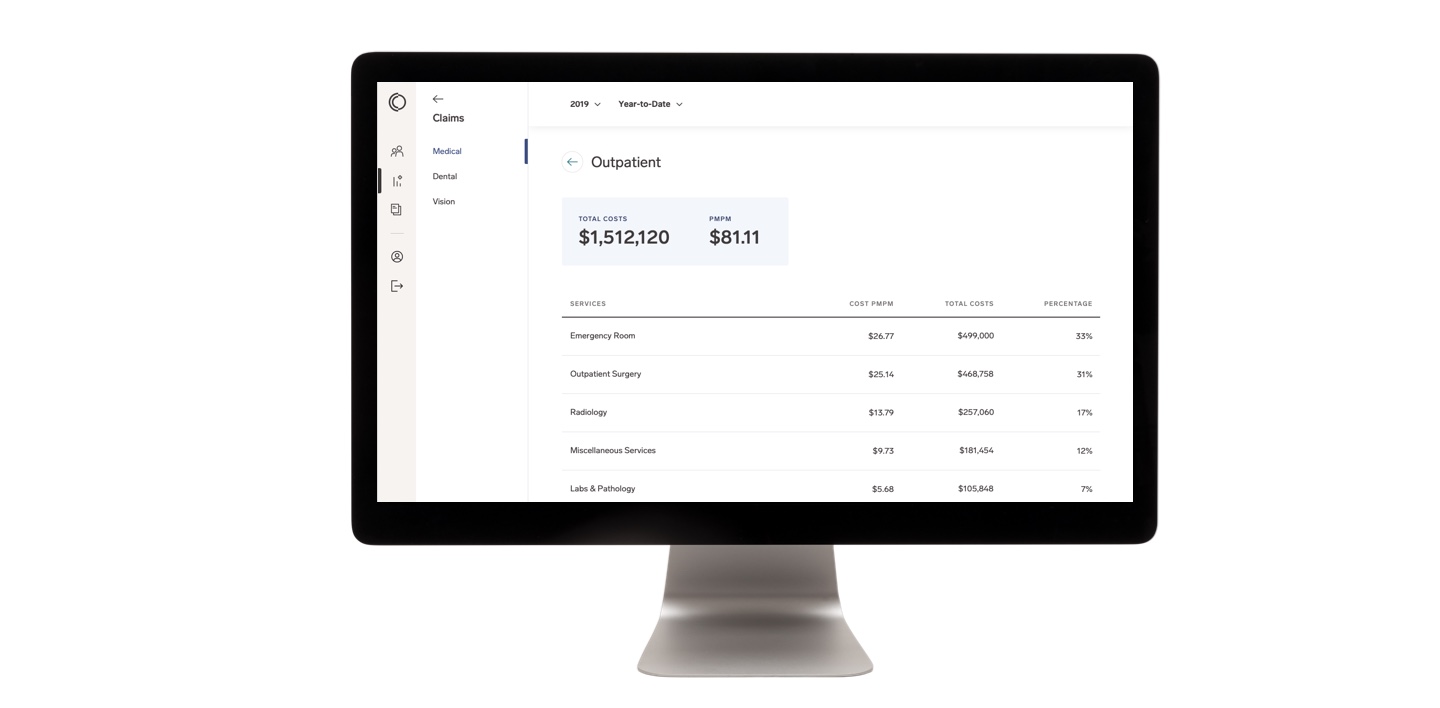
In addition to fresh visuals, we’ve added deep dives into service categories to help benefits teams understand the services their members are using over time and to identify opportunities to influence utilization trends.
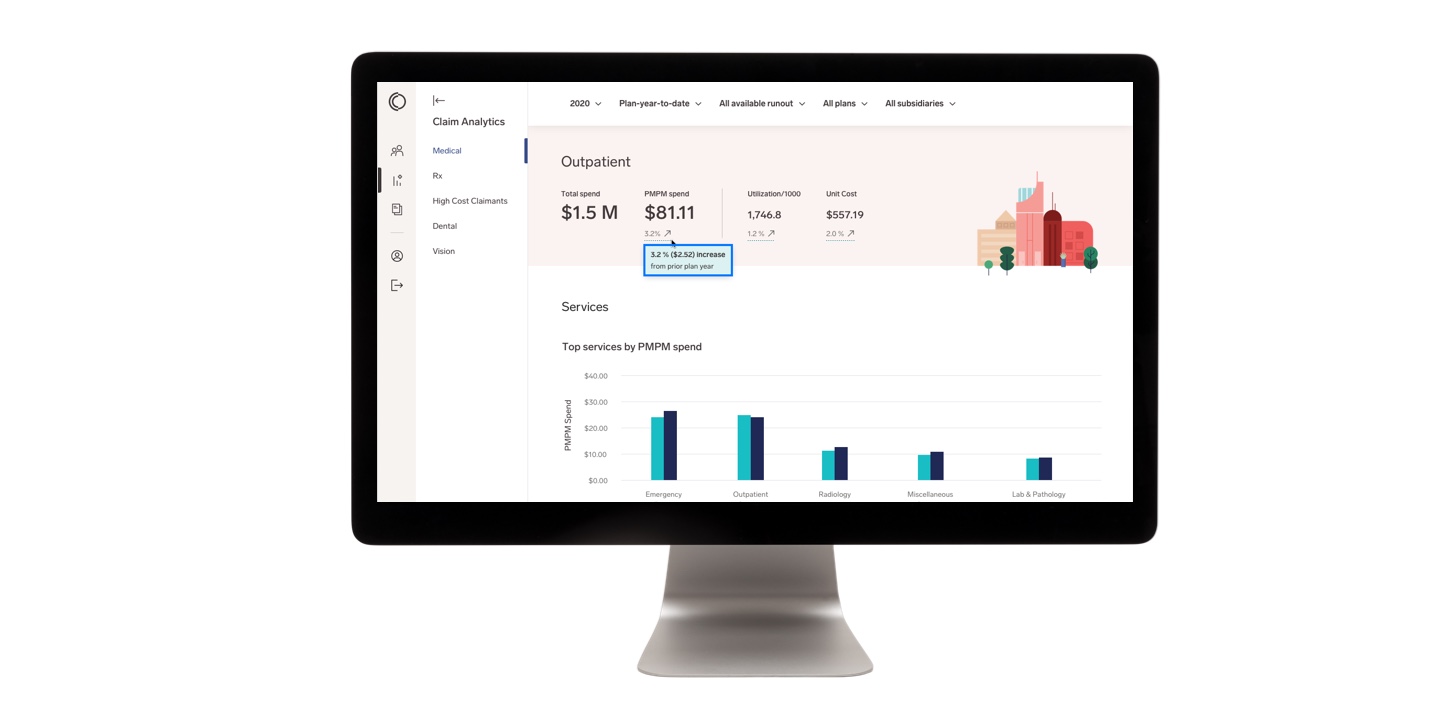
Our new year-over-year service category comparisons and a “top services” graph highlight where the plan spends the most. Finally, we’ve added service detail data to help gauge how service spend fits into medical spend overall and how top service category spend correlates with utilization and unit cost.
Previous Design
New Design
Monitor plan performance with new insight into claims spend
Benefits teams use claims data to meet multiple demands, from budget tracking to forecasting. Collective Health has added filters to slice-and-dice claims spend across varying needs.
Tracking spend as benefits offerings and populations evolve can be a challenge, but access to meaningful data shouldn’t be hampered by change. New plan and subsidiary filters allow benefits teams to explore their data even as plans and populations shift over time.
Runout options are another important addition. For a more complete view of spend—designed to support plan projections and financial planning—multiple runout periods help account for lags in claims processing. For budget-focused needs, choose a finite view, filtered on claims processed dates alone.
Previous Design
New Design
Understanding Your Data
Our tools are built to empower teams to interpret and draw conclusions from their data. As part of our expanded offering and new metrics in the Claims section of Collective Health’s employer suite, we’re introducing a companion guide, Understanding Your Data. The Understanding Your Data guide helps clarify key terms, filter logic, and calculations throughout the Claims section of the employer suite, allowing benefits teams to self-serve.
As new features roll out, we will continue to update this guide.
What’s next:
As the first of several claims insights updates, this launch paves the way for additional claims reporting enhancements. Look forward to expanded data and visualizations in the employer suite, including pharmacy and clinical condition deep dives and benchmark statistics. With these new features and updates, Collective Health brings even more support for benefit leaders and consultants, making it easier and faster for them to understand plan performance today and simpler to put that understanding to actions that positively affect plan performance.
Interested in learning more about how Collective Health can help your company take control of your health spend? Fill this out and someone will be in touch.