At Collective Health we’re using advanced analytics, machine learning, and AI to solve some of the most interesting issues in healthcare and health benefits. We’ve found that sometimes problems and solutions lie in unexpected places.
Air pollution’s impact on health
This October, Napa and Sonoma counties experienced the worst wildfires in recent memory. The fires spread quickly, fueled by high winds that also blew smoke and ash across parts of Northern California that were miles away from the active fires. For days, much of the Bay Area was under air quality advisories, as children, the elderly, and people with breathing issues tried to stay indoors. Others scrambled to buy air masks for when they had to venture outside—the air pollution was as bad as a high pollution day in China.
While Northern California experienced just a few of these high pollution days, they can have serious health consequences. In China—where air pollution leads to high instances of heart disease, lung cancer, stroke, and chronic obstructive pulmonary disease (COPD)—1.8 million people died in 2015 alone due to pollution-linked health conditions.
While much of the focus in countries like China has been on public and environmental policy to reduce overall pollutants, there are opportunities here to address the harmful health effects of pollution and air quality risks through early intervention. So, as the wildfires continued to rage and air quality diminished, we wanted to assess how many of our members might be impacted.
Putting data to work
Collective Health members lived in areas with an Air Quality Index (AQI) of ‘Unhealthy’ or ‘Very Unhealthy’ during the week of the California wildfires. Of these members, nearly 3% had existing medical issues, such as Asthma or Bronchiectasis, that put them at additional risk.
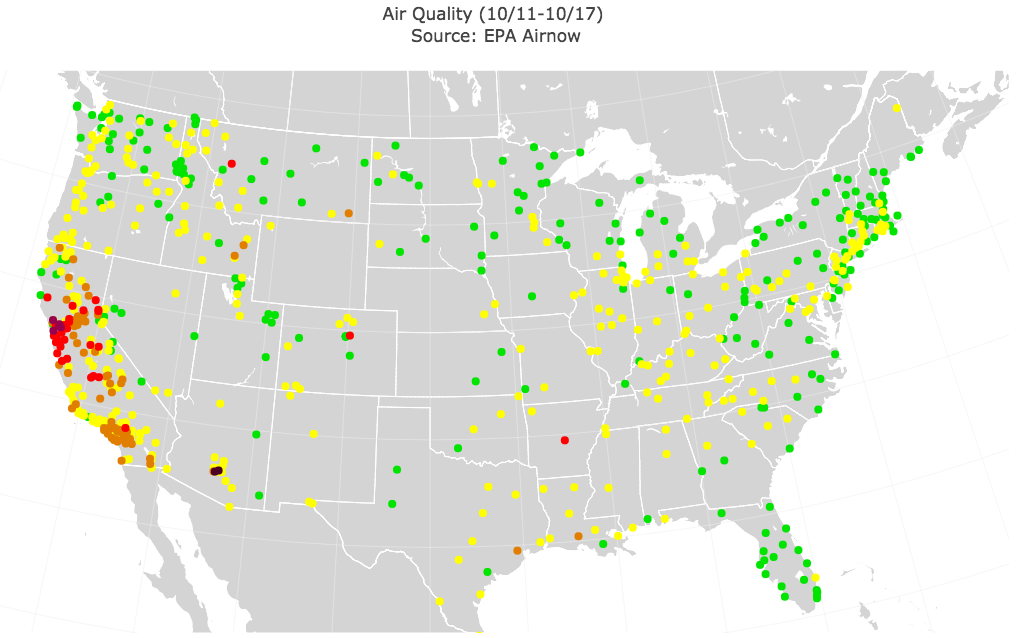
The EPA data comes from a public data feed, updated every half-hour and collected from more than 700 air stations that measure a number of pollutants, including ozone and carbon particulates. These are normalized daily and published as the Air Quality Index (AQI), which has well-defined bands of interpretation, ranging from ‘Good’ to ‘Unhealthy’ to ‘Hazardous’ (with some levels in between). Each interpretation band includes guidelines for the health implications at each level, both for the general population and for those with special conditions such as diseases of the lung. We sampled the data from all air stations during a one-week period at the height of the wildfires.
Air Quality Index (AQI) is reported at locations across the country. In this view, green indicates locations of good air, and red/purple are dangerous or very dangerous air
Separately, we used Cortex—our patent-pending analytics engine—to distinguish members with and without respiratory conditions. Cortex uses a number of signals, including available medical and pharmacy claims data and the person’s demographics. Members deemed particularly sensitive to unhealthy air included those identified with asthma, bronchiectasis/COPD, or lung cancer.
Using the latitude and longitude of the air stations, we computed the closest air station to each plan member. This involved a combination of localization hashing to narrow down candidate air stations for each member, based on a lat/long grid, and computing the actual distance to candidate air stations using the Haversine formula for the distance between lat/lon pairs. Thus, the air quality for each member was determined by taking the closest air station.
The combination of these two data sources allows us to fully apply the health effect statements published by the EPA—expected health effects range from breathing discomfort, to aggravation of conditions, to an extreme health hazard—on a personalized basis.
Potential Applications
These discoveries helped further our discussion around the different ways we can combine our data with publicly available data sets and advanced analytics to help keep our members healthy. For example, during a natural disaster, we can use these data sets to quickly identify members in affected areas and push critical information to those at risk. There are additional third-party data sets that we can incorporate, such as CDC data, that can help us inform our members about things like disease breakouts and flu seasonality. We are exploring ways to bring such real-time environmental awareness to employers to give them relevant insights on the health of their employee populations. This may point toward the need for additional, targeted services that minimize the long-term impact of adverse environmental conditions on employee health.
There is also an opportunity to push truly relevant information to our members that helps them stay healthy. For instance, using this same member and EPA data set, we could alert members with asthma of poor air quality conditions and encourage them to remember their inhaler. So, when a member wakes up and checks their phone they have an alert from Collective Health saying, “The sun is shining, but the air quality is actually poor today. Don’t forget your inhaler!” Our data science team endeavors to always find new ways that we can leverage data to better serve our members by keeping them healthy and informed.
To learn more about the amazing healthcare experience we provide our members, join our upcoming live webinar.


